
The seven-day average of the number of COVID-19 cases per million residents as of April 7, 2022. Louisiana (and the US) are well past their winter-peaks and the current numbers of cases are rather low. The European countries had another peak in March - but now their numbers seem to be starting to go down.
>>>>>> everything below is not updated anymore
Since the end of December 2020, some of the data providers have stopped updating the tables that I used. Now (in May 2021) I am reorganizing my code to include other, up-to-date sources. I will update the figure step-by step, probably over a longer timescale.
The new corona-virus, COVID-19, is currently affecting pretty much all human life on our planet.
Ever since watching the 1995 movie "Outbreak" (which coincided with an EBOLA outbreak in Zaire), I was deeply impressed by virus outbreaks and their potential to cause pandemics. Still, so far, occurrences of Ebola cases, the swine flu, MERS-CoV, the H1N1 pandemic,etc. never affected my personal life, nor the lives of family or friends. So, when COVID-19 started, most of us kind of assumed it would continue to be "someone else's problem". Now we know it is not.
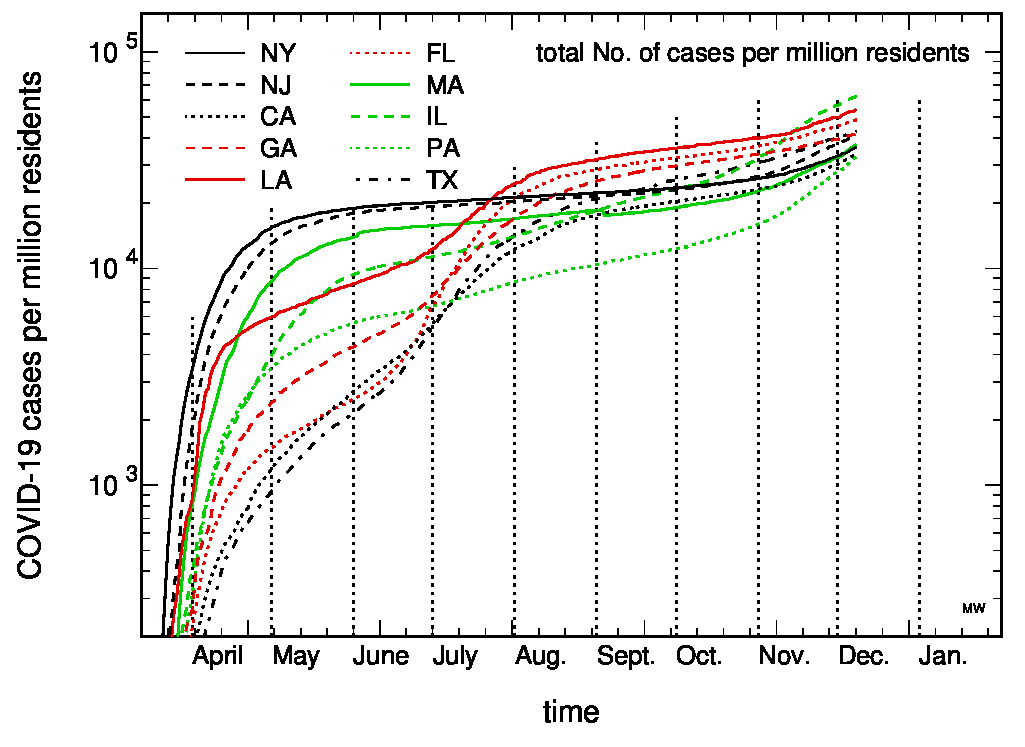
We (which includes a huge fraction of all humans or Earth) have started to practice social distancing, and we will have to continue to do so for quite some time. For how long? I guess, we'll have to see. Certainly, as long as it keeps spreading exponentially. I am a very visual person, so I had to make a figure for this. To visualize exponential growth, data are plotted using a logarithmic y-axis. On this axis, exponential growth appears as a straight line. As long as the exponential growth is intact, one can easily extrapolate the numbers into the future by a straight line. Any change will show up as a downward curvature, until, hopefully, at some point the line becomes horizontal (meaning: no new cases). China seems to have achieved this during February 2020 (although there is some doubt on their numbers). South Korea seems to be getting there. As of mid-March, 2020, the strongest increase in the world was seen in the USA (including Louisiana). During May, all the curves leveled off. At this point it made more sense to look for the number of daily new cases (per capita) - and to avoid the daily fluctuations it made sense to plot rolling seven-day averages.
Total Number of Cases


The total number of cases for the nine leading countries is shown at the very top, and here also for individual US states. It is clearly visible, that after March 16 (when e.g. schools closed here in Louisiana) the curves for all countries and US states increased with smaller rates.
However, since the end of June, the increase is becoming stronger again.
Total Number of Cases per Population

Since the beginning of May, the US has the largest number of cases per No. residents.
Number of New Cases per Day


Here we see the number of new cases per day, normalized to the population (1M residents). Most countries had their peaks around the end of March or the beginning of April and the number of new cases per day was decreasing (with the notable exception of Sweden). For the US, however, since June, the number of new cases is strongly increasing again and has exceeded the previous peak. Louisiana is the first state with a huge spike in April that has now exceeded this by far.
Mortality Rate

The ratio of the total number of deaths over the total number of cases.
Total Number of Deaths
The total number of deaths.

And the number of deaths per one million residents.

Number of Deaths per Day


Lincoln Parish, Louisiana
The last figures shows the number of daily cases for Lincoln Parish, LA.
The first comparison is with Louisiana and the United States.
The first comparison is with Louisiana and the United States.

The other two comparisons are with other Parishes in North Louisiana, those with larger...


No comments:
Post a Comment